Skip to content
How Does Traction Influence Farm Tractor Performance?
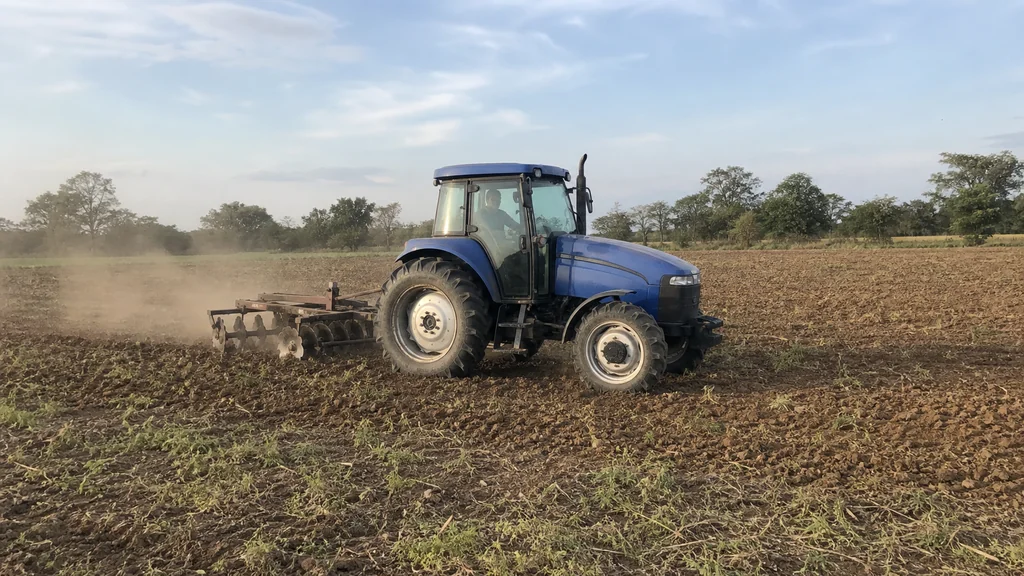
Traction determines how effectively power at a tractor’s drive axles becomes useful drawbar pull at its actual speed. The relevant question is therefore not simply “How much horsepower does the engine produce?” but “How much useful work can the tractor complete under the intended load, soil, moisture, and setup?” The tractor traction relationship connects pull, motion resistance, travel reduction, speed, and tractive efficiency.
Controlled traction can help maintain working speed, implement depth, steering, and effective field capacity. Poor traction can cause excessive slip, lost speed, tire wear, rutting, and higher fuel use per completed operation. However, maximum grip is not the universal objective. Excessive ballast, unsuitable pressure, or operation on vulnerable wet soil may keep the tractor moving while increasing resistance or compaction risk, as explained in soil-compaction guidance.
For operations in Latin America, Africa, and other markets, conclusions should remain model- and condition-specific. Tractor configuration, locally available tires, implement load, actual axle loads, soil strength, moisture, slopes, transport duty, and service support all need verification.
How Does Traction Turn Axle Power Into Drawbar Work?
Traction determines how much axle power becomes useful drawbar pull at the tractor’s actual working speed.
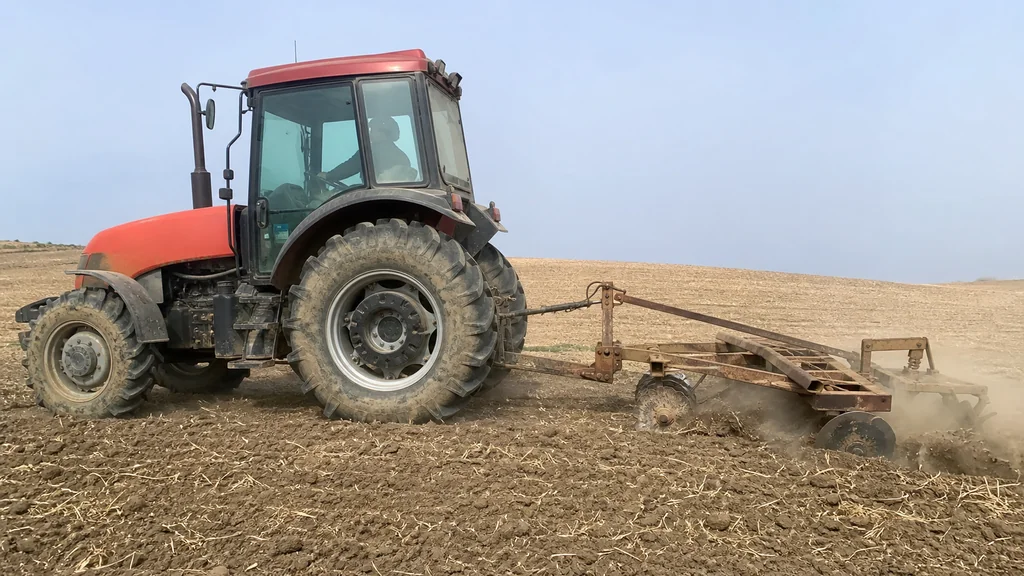
The power path contains several distinct stages:
- Rated engine power is produced under specified test conditions. It is not the power that automatically reaches the ground because accessories, cooling, the transmission, and the driveline consume part of it.
- Axle power is the power delivered to the driven wheels or tracks. It is the correct input reference for evaluating tractive efficiency.
- Gross traction is the total driving force developed at the tire–soil or track–soil interface before resistance is deducted.
- Motion resistance is the force required to move the tractor itself. It includes effects such as tire or track deformation, soil deformation, sinkage, rolling resistance, and grade.
- Drawbar pull, also called net traction, is the useful horizontal pull remaining after motion resistance is deducted.
- Actual travel speed is measured over the ground under load. Slip can make it lower than the theoretical speed calculated from wheel rotation.
Drawbar power depends on both drawbar pull and actual travel speed: drawbar power = pull × actual speed. A tractor can generate substantial pull but deliver disappointing drawbar power if excessive slip reduces its speed. Tractive efficiency is useful drawbar power divided by axle power—not drawbar power divided directly by rated engine power. These definitions follow established drawbar performance terminology1.
This distinction explains why two tractors with similar rated power may perform differently. Tractor mass, dynamic axle loading, tire dimensions, inflation pressure, drivetrain, transmission ratios, ballast, soil strength, implement draft, slip, and motion resistance can all change useful output. A validated soil–tire model2 supports treating these variables as an interacting system rather than independent specifications.
Official tests provide a disciplined starting point. The harmonized tractor-test codes3 and standardized tractor reports4 can support comparisons of PTO, drawbar, hydraulic, and fuel performance. Their measured conditions must still be read carefully: a standardized hard-surface result cannot guarantee performance in a customer’s soil, moisture, slope, tire, ballast, or implement conditions.
Usable field performance should therefore be judged from drawbar pull, actual speed, slip, and completed work—not rated horsepower alone. Fuel comparison should also reflect traction during field operations5, while axle load and soil effects remain part of the performance decision under compaction-risk guidance6.
Drawbar pull is the total traction generated at the tire–soil interface before resistance is deducted.False
That is gross traction. Drawbar pull is the useful net force remaining after motion resistance is deducted.
Tractive efficiency is drawbar power divided by axle power.True
It measures how effectively power delivered to the driven wheels or tracks becomes useful drawbar power.
High drawbar pull by itself guarantees high drawbar power.False
Drawbar power depends on both pull and actual ground speed, so excessive slip can reduce power even when pull is substantial.
Key takeaway: Compare drawbar pull and actual ground speed—not rated horsepower alone—to judge usable field performance.
What Does Wheel Slip Reveal About the Limiting Factor?
Wheel slip is a measured tradeoff that helps separate traction-limited, power-limited, and resistance-limited operation.
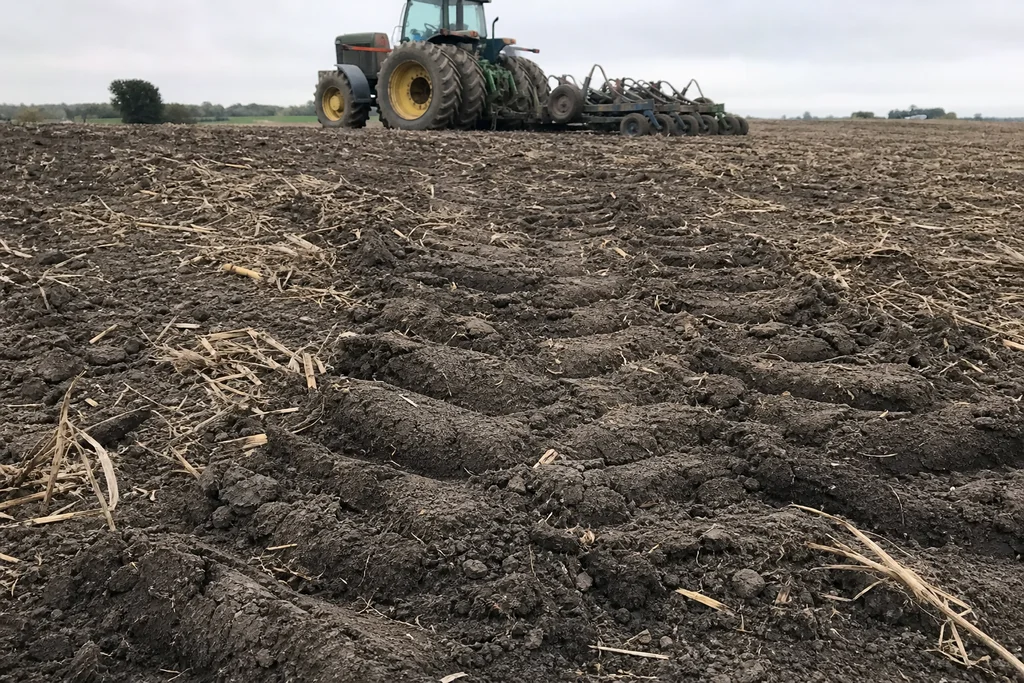
Wheel slip is the difference between theoretical wheel travel and actual travel over the ground. Some positive slip is normally needed for a pneumatic agricultural tire to develop pull in soil, so zero slip is not the normal target for loaded field work. Excessive slip, however, converts energy into soil shearing instead of useful forward movement. The underlying relationship is described in wheel-slip performance analysis1.
Slip percentages are reference points, not universal specifications. For heavier drawbar work, Iowa State guidance gives approximately 8%–13% on firm, untilled soil and 10%–15% on tilled soil under the conditions it discusses conditional field-slip ranges5. Some model-specific guidance uses approximately 10%–15% for 2WD and 8%–12% for MFWD under stated field conditions manufacturer slip guidance7. The applicable target must come from the tractor and tire manufacturers and be checked with the intended implement, soil, moisture, speed, pressure, ballast, and axle loads.
Traction-limited operation may show high slip, lost ground speed while engine speed remains comparatively stable, visible soil shearing, or inadequate pull despite available engine power. Investigate tire condition, pressure, ballast distribution, drive-wheel loading, drivetrain engagement, implement draft, and soil condition.
Power-limited operation may show a substantial fall in engine speed, engine or transmission control limits being reached, and reasonable slip even though the tractor cannot maintain speed. Adding ballast does not create engine power; it may increase mass and rolling resistance.
Resistance-limited operation occurs when sinkage, soft soil, a heavy trailer, unsuitable pressure, grade, or rolling resistance consumes a large share of the available pull. Slip alone cannot diagnose this condition.
The interaction among wheel load, soil strength, resistance, pull, and slip is supported by validated traction modeling2.
Use an onboard slip display, radar, GNSS, or another manufacturer-supported system where available. A manual loaded-versus-unloaded travel comparison should only follow a documented safe slip-measurement procedure8. Never approach, mark, or measure a tire while the tractor is moving.
Record theoretical or no-load travel, actual loaded travel, ground speed, gear, engine speed, implement depth or load, soil and moisture, tire pressure, and ballast. Repeat measurements because one field location may not represent changing soil strength, moisture, slope, or previous traffic. Practical slip and ballast guidance9 can help interpret results, but the operator’s manual remains controlling.
Key takeaway: Measure slip under load and identify the real limiting factor before changing tires, ballast, pressure, or implement settings.
How Do Soil Moisture and Compaction Change Traction Decisions?
Soil strength and moisture change pull, slip, resistance, sinkage, and the risk of damaging the soil profile.
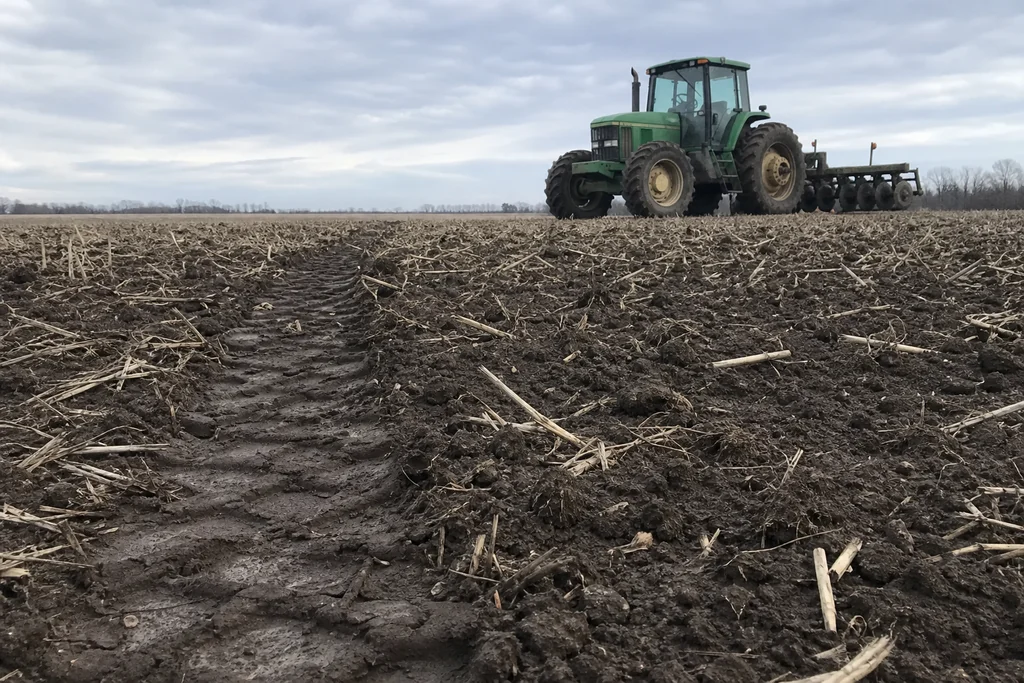
Traction is produced through interaction with the soil. Texture, moisture, strength, cohesion, residue, tillage condition, previous traffic, sinkage, slope, and compaction can all alter the result. A dry yard or hard test surface therefore cannot fully predict performance in working soil.
A field experiment involving a 78-kW tractor during plowing found that soil moisture changed axle torque, slip, traction force, traction coefficient, and tractive efficiency measured moisture effects10. Those outcomes belong to the experiment’s tractor, soils, moisture range, and plowing setup. They do not establish a universal rule that wetter soil always increases or decreases traction.
A validated traction-performance model2 similarly shows why pressure, wheel load, tire dimensions, soil strength, slip, pull, and motion resistance must be considered together. Model predictions are useful for exploring interactions, but they are not guaranteed field outcomes.
Compaction introduces a second performance boundary. Tire inflation pressure and footprint strongly influence stress near the surface, while total axle load is especially important to deeper compaction risk. Lower surface pressure cannot fully compensate for an excessively heavy axle. This distinction is explained in axle-load compaction guidance6.
Lowering pressure within the approved load-and-speed table may enlarge the footprint, reduce sinkage, and improve traction. Going below the permitted pressure can overload the casing, overflex the sidewall, move or unseat the bead, and reduce stability. Penn State’s tire-pressure and footprint guidance11 connects pressure selection with axle load and compaction risk.
When soil is wet enough to be vulnerable, the fact that a tractor can continue moving does not prove that operation is agronomically suitable. Where traction materially affects a purchase or setup decision, test representative soil texture, moisture, working depth, implement load, field speed, pressure, and ballast. Record rutting, sinkage, smearing, and soil displacement as well as pull and slip.
How Should Tires, Pressure, Ballast, and Axle Loads Be Matched?
Tire design, cold pressure, ballast, and dynamic axle loading must be matched as one model-specific setup.
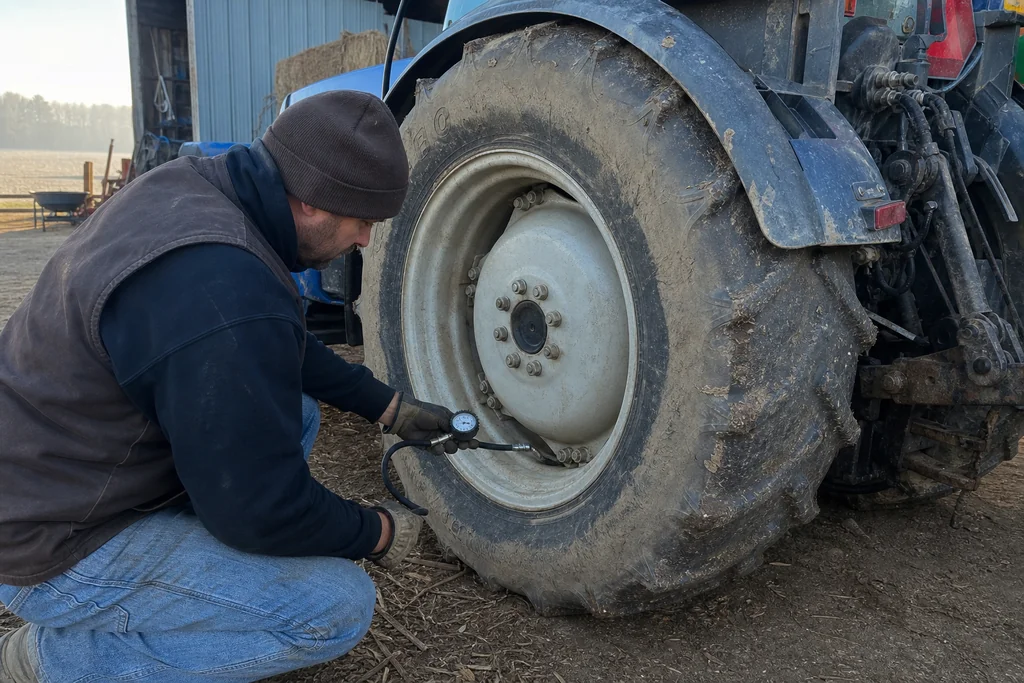
Start with axle loads, not a generic pressure or ballast recommendation. Weigh the front and rear axles with the intended implement or trailer in the relevant working and transport positions. A raised mounted implement, drawbar load, loader, slope, acceleration, and braking can shift weight between axles, so bare-tractor scale weights are not sufficient for every condition.
Pressure is a load-and-speed specification. Select cold inflation pressure from the exact tire model and size, construction, number of tires on the axle, measured axle load, implement position, maximum speed, and field or transport duty. Use the tire manufacturer’s load-and-inflation table and observe tractor restrictions.
The load-based pressure method11 is more defensible than copying another tractor’s pressure.
Overinflation can reduce the footprint and increase slip or surface stress in loose soil. Underinflation can overflex or damage the casing, generate heat, allow bead movement, and reduce steering stability. Field and road requirements may differ.
Tire and track systems are conditional choices. Radial tires can often flex more than comparable bias-ply tires and may operate with a larger footprint or lower permitted pressure. Bias-ply tires may remain suitable where their load capacity, durability, service availability, rim fit, terrain, or road duty is a better match.
A soil–tire interaction model2 supports evaluating pressure, size, load, soil, and slip together rather than declaring one construction universally superior.
Duals or triples can divide axle load among more tires and may permit lower pressure, but they also change machine width, row clearance, transport access, tire matching, rim loading, and service requirements. Tracks may reduce sinkage or improve flotation in some conditions, yet high machine or axle load can still compact deeper soil. Turning behavior, road travel, ride, maintenance, and replacement support also differ. The distinction between footprint effects and deep compaction from axle load6 remains relevant to both tires and tracks.
Ballast is adjustable, not automatically beneficial. Too little drive-wheel load can contribute to excessive slip and poor steering with some mounted implements. Too much ballast can increase rolling resistance, tire and axle loading, compaction, driveline stress, and energy demand.
Follow model-specific ballast limits7 and use only the amount and distribution needed for the job. Do not exceed the lowest applicable tractor, axle, tire, rim, hitch, loader, implement, or transport limit.
Slip measurements can indicate whether the current mass and distribution need investigation, but they do not replace axle weighing or tire tables. Use field energy and ballast guidance9 alongside the model-specific manual.
Some high-draft radial-tire combinations may develop repeated bouncing known as power hop. Because it can involve pressure, tire stiffness, dynamic loading, weight distribution, soil, drawbar load, and speed, follow the tractor manufacturer’s troubleshooting sequence rather than applying one universal pressure or ballast change.
When Do 2WD, MFWD, or 4WD Fit the Work?
Driven-axle configuration affects how weight and tire capacity are used, but no drivetrain wins every traction metric.
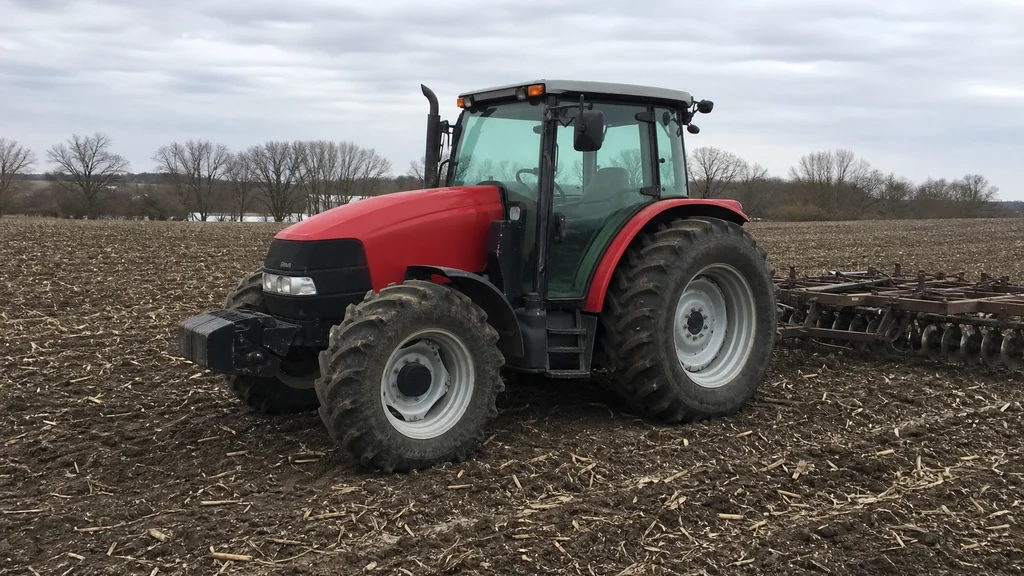
2WD normally drives the rear axle. It may fit lighter draft work, firm surfaces, transport, or operations that do not need another driven axle.
MFWD, also called mechanical front-wheel drive or front-wheel assist, drives both front and rear axles during selected operations. Correctly configured MFWD can use front-axle weight for traction and may reduce excessive slip during higher-draft or lower-strength conditions.
True or equal-wheel 4WD commonly refers to large tractors with four similarly sized driven wheels or an articulated chassis. It is not identical to conventional MFWD, so specifications and test results should not be combined without checking the configuration.
MFWD or 4WD may be useful where draft is high, soil strength is low, weight can be distributed effectively, or front-axle traction supports mobility and steering. Additional driven axles do not create engine power, automatically reduce implement draft, guarantee lower fuel use, eliminate ballast requirements, or remove compaction risk. Manufacturer drivetrain and ballast guidance7 should control engagement and setup decisions.
MFWD tire matching is both a performance and driveline requirement. Front and rear tires must match the tractor’s axle-speed ratio, approved rolling-circumference groups, construction requirements, load and speed ratings, and permitted front-wheel lead. Similar sidewall size markings do not prove compatibility because actual rolling circumference can vary with brand, tread, wear, load, and pressure.
Incorrect lead or lag can contribute to tire wear, difficult steering, reduced traction, driveline wind-up, and component stress. Use only approved MFWD tire combinations12 and the tractor manufacturer’s calculation procedure; there is no universal lead percentage.
Finally, treat modeled comparisons carefully. The 2026 tractor–semi-trailer study is a conditional drivetrain simulation13. It can illustrate relationships among soil, payload, slip, speed, tire construction, drive configuration, and fuel use, but its outputs are predictions—not proof that one drivetrain or tire construction is universally more efficient.
The choice should also consider turning behavior, road-use instructions, maintenance complexity, tire replacement, parts availability, and qualified local service.
How Should Fuel and Traction Test Results Be Compared?
Fuel use should be compared against completed work while every test result remains tied to its measured or modeled conditions.
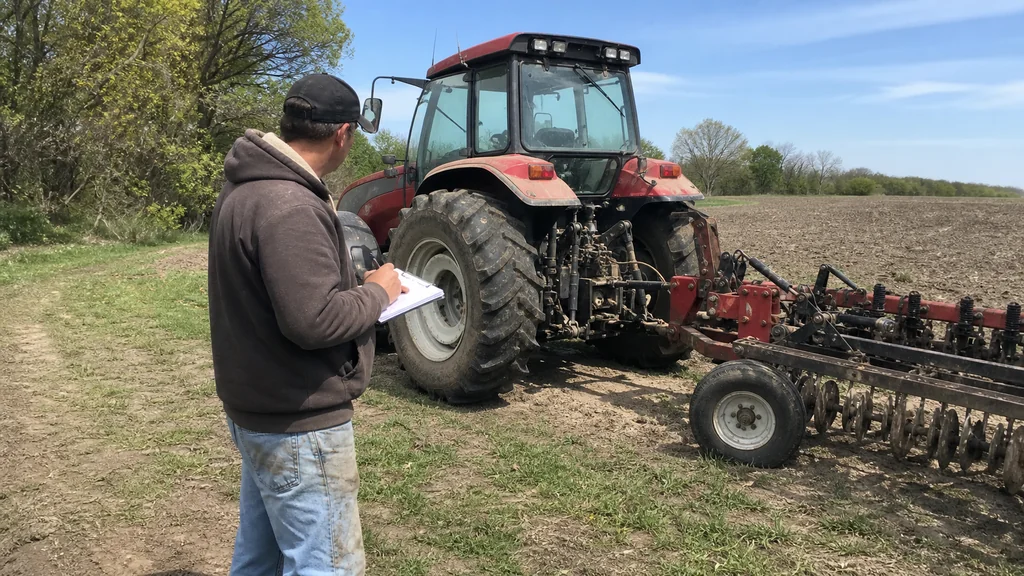
Liters per hour reveal fuel flow, not how much useful work was completed. A tractor may use less fuel per hour yet take longer, travel more slowly, slip more, cover less area, or require additional passes.
For field work, compare fuel per hectare or acre, actual working speed, drawbar pull, drawbar power, slip, width, depth, effective field capacity, and total completion time. For transport, compare fuel per tonne-kilometre or per completed haul while holding payload, route, speed, and loading assumptions consistent. Iowa State’s field fuel-efficiency guidance5 also points to OECD tractor tests as a comparison resource.
Effective field capacity includes more than traction. Turning, overlap, headland time, loading, unloading, adjustment, stops, and field shape also affect completed work. Traction mainly influences whether the intended speed and load can be maintained without excessive slip, rutting, or interruption.
Keep the evidence hierarchy visible:
- Official standardized tests provide controlled comparison data, but their conditions must accompany every number.
- Measured field experiments show what happened in a stated tractor, implement, soil, moisture, and operating setup. The cited soil-moisture field experiment10 should not be generalized beyond its plowing conditions.
- Another defined tillage experiment14 compared a particular rigid lugged wheel with a conventional tire during moldboard plowing. Its fuel, slip, and productivity results do not establish general radial-versus-bias performance.
- Validated models can explore interactions not tested in every combination. The validated soil–tire model2 is decision support, not a field guarantee, and reported limitations under some high-load and low-pressure combinations.
- Simulations are conditional illustrations. The tractor–semi-trailer simulation13 should not override manufacturer instructions, official tests, or measured field evidence.
Reject any fuel or productivity claim that does not state the tractor and drivetrain, tire setup, ballast, axle loads, soil or road condition, moisture, implement or payload, speed, slip, and measurement method. Results from different conditions should not be ranked as though they were a single test.
How Can Poor Tractor Traction Be Diagnosed Safely?
A controlled diagnosis records conditions, measures slip and axle loads, checks tires and the implement, and changes one variable at a time.
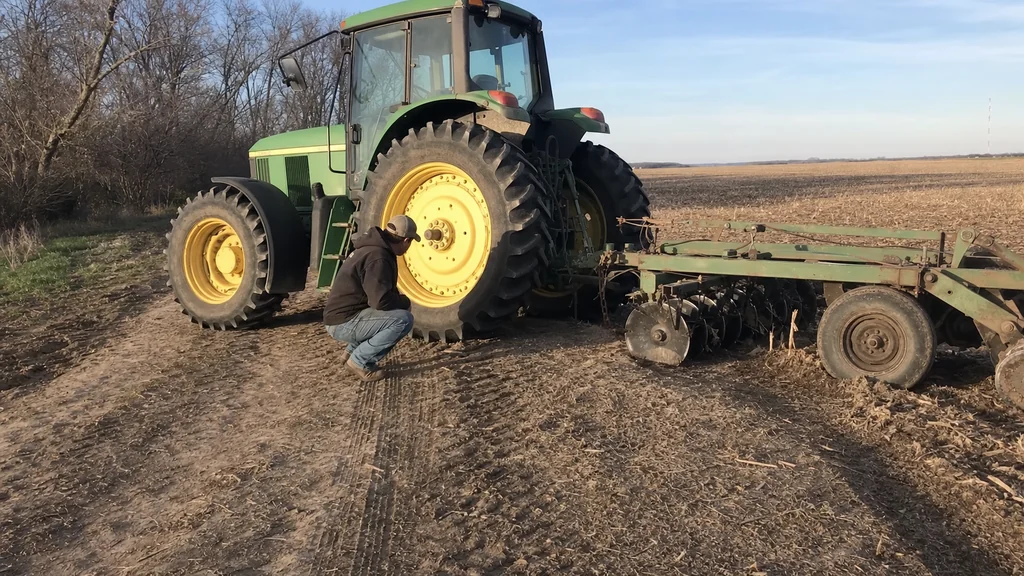
Use a repeatable sequence when the tractor cannot maintain expected pull or speed:
-
Confirm the equipment. Record the tractor model, serial or PIN range, drivetrain, transmission, tire sizes and construction, ballast, implement, and load.
-
Confirm the operating condition. Record soil, moisture, slope, previous traffic, working depth, intended speed, gear, and engine speed.
-
Identify the likely limit. Look for traction-limited, power-limited, or resistance-limited signs. Do not diagnose from slip alone.
-
Measure slip safely. Prefer the onboard system. If a manual method is required, follow the operator’s documented slip procedure8. Never approach a moving tire.
-
Measure axle loads. Weigh the tractor in the relevant working and transport configurations, including the implement, trailer, loader, payload, and ballast.
-
Verify cold tire pressure. Match tire model, size, construction, axle load, number of tires, and maximum speed to the approved load-and-inflation table. Follow load-based pressure guidance11.
-
Check ballast and weight distribution. Confirm steering-axle loading and every tractor, axle, tire, rim, hitch, implement, and transport limit against manufacturer ballast instructions7.
-
Inspect tires or tracks. Check damage, wear, tread direction, mismatched duals, spacing, rims, and track condition.
-
Verify MFWD setup. Confirm engagement, permitted front and rear tires, rolling circumference, and front-wheel lead using MFWD compatibility guidance12.
-
Check the implement. Verify working width and depth, adjustment, hitch geometry, draft, soil buildup, and whether the load is appropriate for the available power.
-
Change one variable at a time. Repeat the same task under comparable conditions and record the result before making another adjustment.
-
Stop for safety hazards. Seek qualified support for tire damage, overload, driveline wind-up, loss of steering or braking control, hitch instability, unstable bouncing, or any other unsafe condition.
This sequence does not replace the operator’s manual or a model-specific service procedure.
Key takeaway: Follow a repeatable measurement sequence and stop for tire, axle, driveline, steering, braking, hitch, or stability hazards.
What Should Buyers Verify Before Choosing a Traction Setup?
A defensible purchase decision requires standardized reports, written test conditions, setup limits, and locally supportable tires and service.
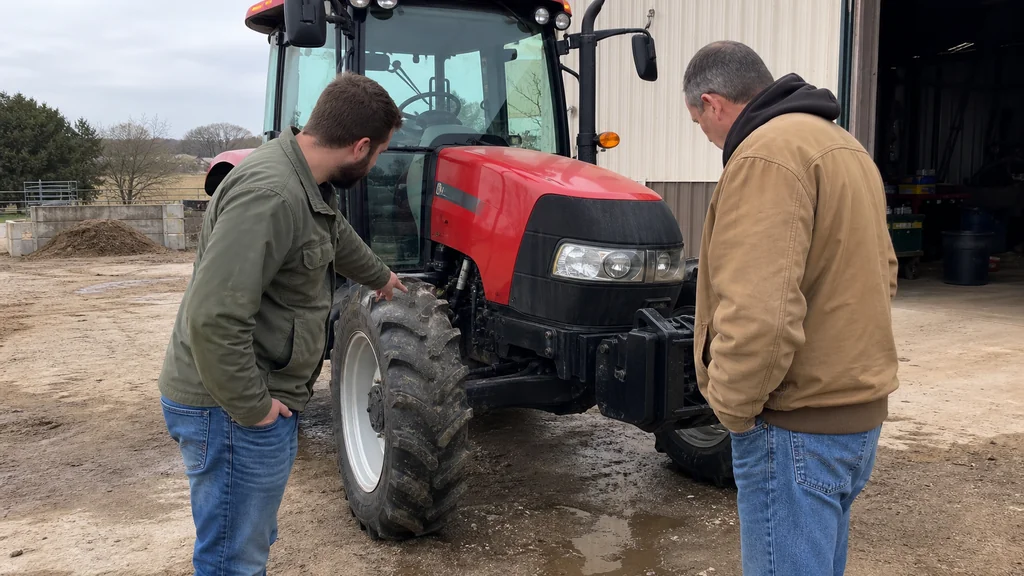
Before comparing tractors or changing an existing setup, record:
- Tractor make, model, and serial or PIN range
- Rated engine and PTO power
- Transmission and 2WD, MFWD, or true 4WD configuration
- Intended implement or trailer
- Working width, depth, draft, or payload
- Target actual working speed
- Expected soil textures, moisture conditions, slopes, and transport duty
- Tire or track model, size, construction, load rating, and speed rating
- Actual front and rear axle loads in working and transport positions
- Ballast type and location
- Local availability of compatible tires, rims, parts, calibration, and qualified service
Ask the supplier to provide:
- An official OECD, Nebraska, or equivalent test report where available
- Drawbar pull, actual speed, drawbar power, slip, and fuel data from the same stated test condition
- Written assumptions behind productivity or fuel estimates
- Permitted tractor, axle, tire, rim, hitch, loader, and transport loads
- Model-specific ballast and weight-distribution instructions
- Tire load-and-inflation tables for field and road duty
- Approved MFWD front and rear tire combinations
- Required rolling circumference and front-wheel-lead procedure
- A demonstration under representative soil, moisture, depth, implement load, speed, pressure, and ballast where practical
- Operator training for pressure, ballast, slip measurement, and drivetrain use
- Confirmation of locally supportable tire, rim, driveline, and calibration requirements
Rank evidence by authority. Start with model-specific ballast instructions7, approved slip measurement8, and MFWD tire requirements12. Then use harmonized official test codes3 and recognized tractor-test reports4.
Use tire-manufacturer data supported by practical axle-load pressure guidance11, field slip guidance9, completed-work fuel guidance5, and soil-compaction guidance6.
Technical references and research can explain mechanisms: traction performance definitions1, validated traction modeling2, measured moisture effects10, and a defined tillage experiment14. Keep simulation-based traction predictions13 below manufacturer requirements, official tests, and measured field evidence.
For Latin American and African markets, do not convert results from another country, soil, tractor class, or experiment into a regional promise. A hard-surface test is a comparison baseline—not a guarantee for the customer’s field.
Key takeaway: Ask suppliers for traceable performance assumptions and model-specific limits without turning one market, experiment, or simulation into a regional promise.
Conclusion
Traction influences farm tractor performance by controlling how much axle power becomes useful drawbar pull at an actual working speed. The correct objective is controlled, repeatable performance—not zero slip, maximum ballast, minimum pressure, or one supposedly superior tire or drivetrain.
A defensible setup verifies the complete tractor–tire or track–soil–implement system. Measure slip and axle loads, select pressure from approved load-and-speed data, keep ballast within model-specific limits, protect steering and stability, and compare fuel against completed work. Where traction is commercially important, require test conditions that resemble the intended operation and confirm local parts, tire, rim, and service support.
References
-
Technical reference defining gross traction, motion resistance, drawbar pull, slip, and tractive efficiency. - esalq.usp.br ↩ ↩ ↩
-
Validated soil-tire model covering pressure, wheel load, tire dimensions, soil strength, slip, pull, resistance, and efficiency. - sciencedirect.com ↩ ↩ ↩ ↩ ↩ ↩
-
Official standardized tractor-test codes used to interpret drawbar, PTO, hydraulic, and fuel test results. - oecd.org ↩ ↩
-
Recognized tractor test reports providing standardized performance comparison data. - tractortestlab.unl.edu ↩ ↩
-
Extension guidance for comparing tractor fuel efficiency with traction and completed field work. - crops.extension.iastate.edu ↩ ↩ ↩ ↩
-
Extension evidence distinguishing surface contact pressure from axle-load effects on deeper soil compaction. - extension.umn.edu ↩ ↩ ↩ ↩
-
Manufacturer guidance on ballast, weight distribution, wheel slip, and tractor setup. - manuals.deere.com ↩ ↩ ↩ ↩ ↩
-
Manufacturer procedure for safely measuring and interpreting wheel slip. - manuals.deere.com ↩ ↩ ↩
-
Practical extension guidance on wheel slip, ballast, tire pressure, and field energy efficiency. - extension.psu.edu ↩ ↩ ↩
-
Field experiment showing that soil moisture changes several traction metrics in a defined plowing setup. - sciencedirect.com ↩ ↩ ↩
-
Extension guidance connecting tire pressure, axle load, footprint, traction, and compaction risk. - extension.psu.edu ↩ ↩ ↩ ↩
-
Manufacturer requirements for compatible front and rear MFWD tire combinations and rolling circumference. - manuals.deere.com ↩ ↩ ↩
-
Simulation illustrating conditional interactions among soil, payload, slip, speed, tire construction, drivetrain, and fuel use. - nature.com ↩ ↩ ↩
-
Field experiment evaluating traction power transfer, fuel use, and field productivity under defined tillage conditions. - doi.org ↩ ↩